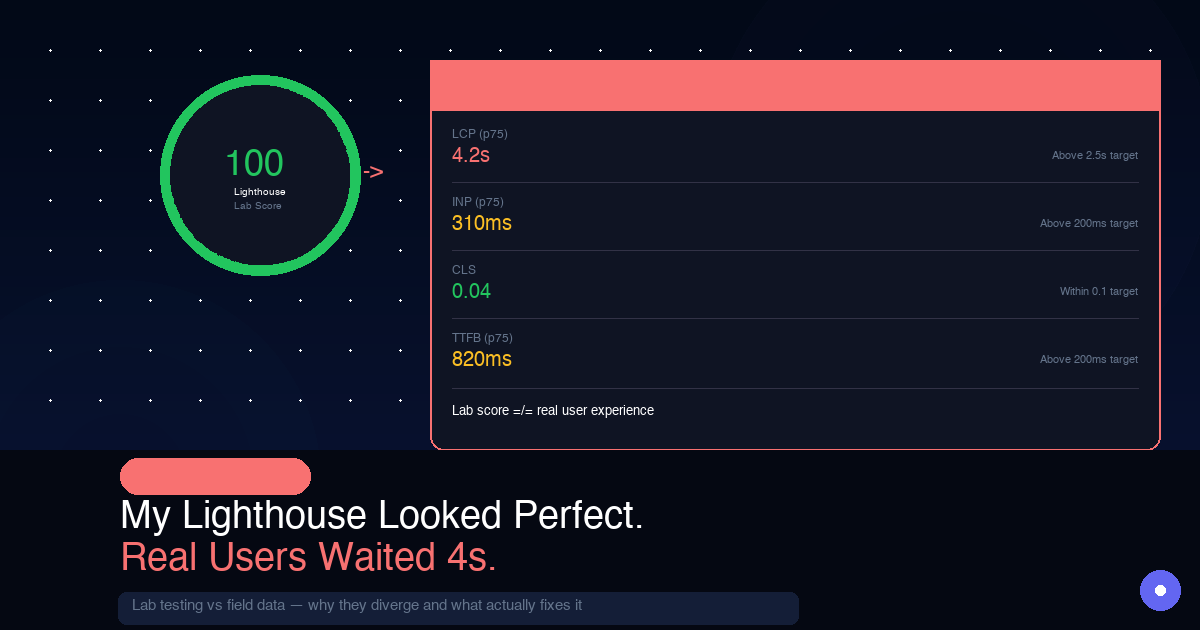
Most performance advice online tells you to run Lighthouse once and fix whatever breaks. That tells you less than half the story.
Lighthouse runs on a simulated device in a data center. Your users are on real phones, real networks, in real cities. The gap between the lab report and the real-user data is often the whole problem.
Last week we audited OnlyFrontendJobs both ways — Lighthouse on every key page, and PostHog real-user monitoring across 30 days of production traffic. The results forced us to rewrite our fix list mid-audit.
The synthetic scores looked great
We ran Lighthouse 13 against the homepage, the job listing page, and a job detail page — desktop and simulated mobile 3G.
| Page | Desktop Perf | Mobile Perf | Mobile LCP | Mobile TBT |
|---|---|---|---|---|
| Homepage | 99 | 87 | 2.1s | 390ms |
| /jobs | 98 | 86 | 2.0s | 480ms |
| Job detail | 99 | 64 | 6.3s | 490ms |
Desktop scores were near-perfect. Mobile was mixed: the homepage and listing page scored in the mid-80s with LCP around 2 seconds, but the job detail page tanked to 64 with LCP at 6.3 seconds — two and a half times above the threshold.
The lab data pointed at three things:
- The job detail page had no preloaded hero image, so the company logo (the LCP element) waited behind JavaScript parsing.
- Every page shipped 213—251 KB of unused JavaScript.
react-markdownandframer-motionsat in shared chunks that every route loaded. - The Chrome back/forward cache was blocked on
/jobsby a PostHogcapture_pageleavelistener and avisibilitychangeevent in the service-worker update banner.
So far, so standard. But we had a PostHog pipeline already sending Core Web Vitals as web_vital events. Before touching any code, we pulled the field data.
The real-user data told a different story
PostHog showed us 7,500+ INP measurements, 4,500+ LCP measurements, and 5,800+ CLS measurements from the last 30 days. Here is what actual users experienced at the 75th percentile:
| Metric | p50 | p75 | p95 | Target |
|---|---|---|---|---|
| LCP | 1,125ms | 2,108ms | 4,688ms | ≤ 2,500ms |
| INP | 112ms | 216ms | 512ms | ≤ 200ms |
| CLS | 0.02 | 0.069 | 0.298 | ≤ 0.1 |
| FCP | 1,024ms | 3,434ms | 9,638ms | ≤ 1,800ms |
Three things jumped out.
First, FCP was terrible. The lab audit had us focused on LCP and TBT. But real users waited 3.4 seconds just to see any paint at all — nearly double the target. The lighthouse FCP score was misleading because simulated 3G throttles the network, not the device CPU. Real mid-range phones parse JavaScript much slower than a data-center VM.
Second, LCP was borderline everywhere. At 2.1 seconds p75 across all pages, we were under the 2.5-second threshold but not by much. Some job detail pages (Swiggy, Angel One) hit 3.2 seconds at p75. The lab report's 6.3-second figure was a worst-case detail page — but the field data showed that many detail pages were close to failing.
Third, CLS was pristine. Zero layout shift problems. The design system's approach of reserving space for images and using CSS animations instead of Framer Motion on the critical path paid off.
The gap between lab and field FCP forced us to broaden the investigation. Lighthouse blamed large JavaScript bundles for TBT. But FCP is more sensitive to how that JavaScript is structured — how many client boundaries the hydration pass has to walk through before the browser can commit the first paint.
What lab missed: the provider tax
Every React context provider in a Next.js layout is a separate client boundary. Each one adds a hydration step. Our root layout had seven providers nested inside <body>:
ReactQueryProvider → ConsentProvider → PostHogProvider → AuthProvider
→ SalaryHydrationProvider → ColorModeProvider → FrameworkThemeProvider
Seven boundaries meant seven hydration passes before the first meaningful content was interactive. On fast desktop CPUs, this is invisible. On a ₹15,000 Android phone in Bengaluru, it adds 1—1.5 seconds to FCP.
The fix is a single ProvidersShell component that wraps all seven providers behind one 'use client' boundary. The <html> and <body> tags stay server-rendered. Only the context tree hydrates as one unit.
// src/app/ProvidersShell.tsx
'use client'

export default function ProvidersShell({ children }) {
  return (
    <ReactQueryProvider>
      <ConsentProvider>
        <PostHogProvider>
          <AuthProvider>
            <SalaryHydrationProvider>
              <ColorModeProvider>
                <FrameworkThemeProvider>
                  {children}
                </FrameworkThemeProvider>
              </ColorModeProvider>
            </SalaryHydrationProvider>
          </AuthProvider>
        </PostHogProvider>
      </ConsentProvider>
    </ReactQueryProvider>
  )
}
The key constraint: content components like FooterWrapper and MobileBottomNav stay in the server-rendered layout and pass through as children. If you move them inside the 'use client' boundary, they import server-only code (pg, database queries) that breaks the build.
What we actually shipped
The full PR landed with ten changes across four areas.
LCP: company logo preload. The job detail page now calls React 19's preload() right after fetching the job data, using the same URL resolution that the rendered <Image> component uses. On cached pages, the logo starts loading before the component tree renders.
Bundle size: two ~200 KB chunks removed from shared bundles. react-markdown is now dynamically imported on the three pages that need it (changelog, admin build-in-public, admin digest). Framer Motion is dynamically imported for four below-fold components (PostJobModal, AIExtractionLoader, ReferralBadge, OutreachGenerator). The PostJobModal render is gated behind {isOpen && <PostJobModal />} so the chunk only loads on click.
TBT / INP: salary fetch deferred. The SalaryHydrator component, which fetches salary data for authenticated users on every job listing page, now defers its fetch via requestIdleCallback with a setTimeout fallback for Safari. The 2-second Safari timeout matches the idle threshold so Safari users still get salary data, just slightly later.
bf-cache: two blockers removed. PostHog's capture_pageleave event is now disabled — the page view tracking is sufficient. The AppUpdateBanner component switched from visibilitychange (which marks a page as bf-cache ineligible) to pageshow with event.persisted (which fires on bf-cache restore without the penalty).
Accessibility. Added a <main> landmark to the job detail page, an sr-only heading bridge on the job listing to fix the heading hierarchy, and 44-pixel minimum touch targets on all filter chips.
Console noise. Fifteen data-fetching catch blocks had console.error calls that logged nothing useful to the browser console. All fifteen already had silent fallbacks — the console call was dead weight. Removed across the board.
What we did not fix — and why
Three plan items were dropped after investigation.
openai is already server-only. The BUNDLE_ANALYSIS.md had "move OpenAI to API route" as an open task, but every import OpenAI from 'openai' in the codebase already lives in server-only files (src/lib/, src/app/api/). Zero client-side imports. Fixing a problem that does not exist.
webpack splitChunks does not work with Turbopack. Next.js 16 builds with Turbopack by default. The webpack configuration property in next.config.ts is silently ignored. There is no Turbopack equivalent for manual chunk splitting yet, so this waits for framework support.
Provider extraction via React.lazy causes remounts. The original plan proposed wrapping PostHogProvider in a lazy-loaded boundary. But React.lazy on a provider unmounts and remounts all children when the chunk loads — destroying auth state, theme settings, and triggering duplicate effects. Not worth the remount cost.
How to audit your own site with real data
If you have PostHog (or any analytics tool that captures Web Vitals), the query to pull your p50/p75/p95 distributions is straightforward. In PostHog's HogQL:
SELECT
  properties.metric_name AS metric,
  round(quantile(0.50)(properties.metric_value), 0) AS p50,
  round(quantile(0.75)(properties.metric_value), 0) AS p75,
  round(quantile(0.95)(properties.metric_value), 0) AS p95,
  count() AS count
FROM events
WHERE event = 'web_vital'
  AND timestamp > now() - INTERVAL 30 DAY
GROUP BY metric
ORDER BY count DESC
Add properties.page_url to the GROUP BY to get page-level breakdowns. Compare the field data against your Lighthouse scores. If FCP in the field is much worse than Lighthouse suggests, check your provider boundaries.
The bottom line
Lighthouse gives you a clean-room score. Real-user data gives you the truth. The two together tell you where to spend your time.
For OnlyFrontendJobs, the synthetic audit drove the LCP and bundle fixes. The real-user data drove the FCP fix that the synthetic audit did not even flag. If we had shipped only the Lighthouse-driven changes, we would have missed the single biggest pain point for actual visitors.
Run both. Act on both. The gap between them is where your real performance problems live.
The full code changes are at PR #240. We will re-pull the PostHog data after a week of production traffic and publish the before/after comparison.